How Much CO2 Does Your Social Media Habit Cost The Planet? New Tool Visualises Emissions From Internet Activity
3 Mins Read
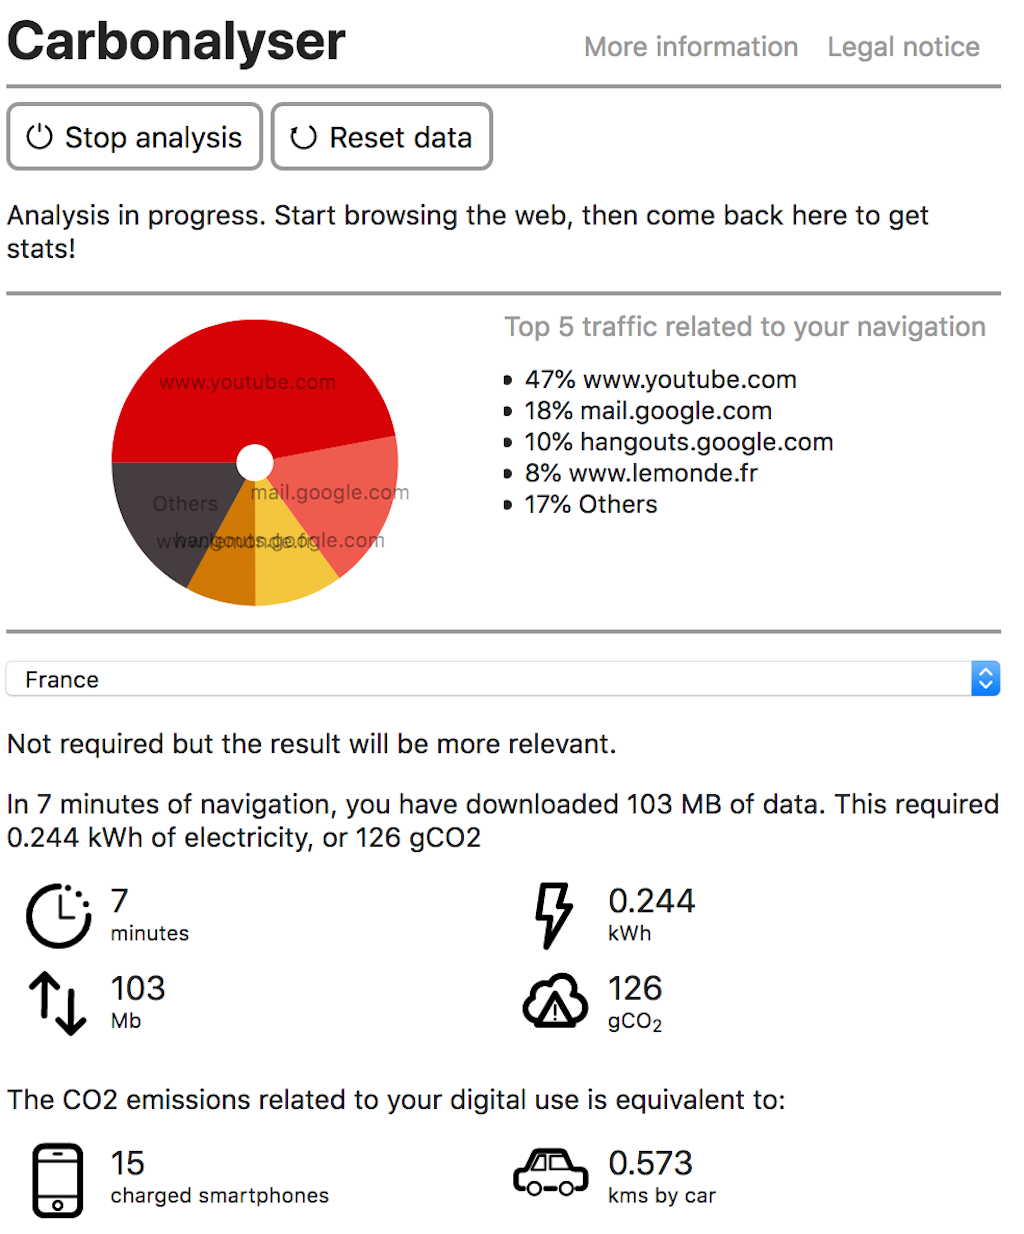
Carbonanalyser is a new browser extension that allows users to see the climate impact of your internet activity. It goes further than simply calculating your online carbon emissions and reveals which websites or apps are consuming the highest amount of electricity on your device. The add-on also enables users to compare the greenhouse gas emissions from your internet searching to the emissions generated by other sources, such as charging a smartphone or driving a car.
Developed by The Shift Project, a French think tank and nonprofit advocating for a zero-carbon economy, the “Carbonanalyser” browser extension allows users to see their electricity consumption and greenhouse gas emissions created from internet browsing.
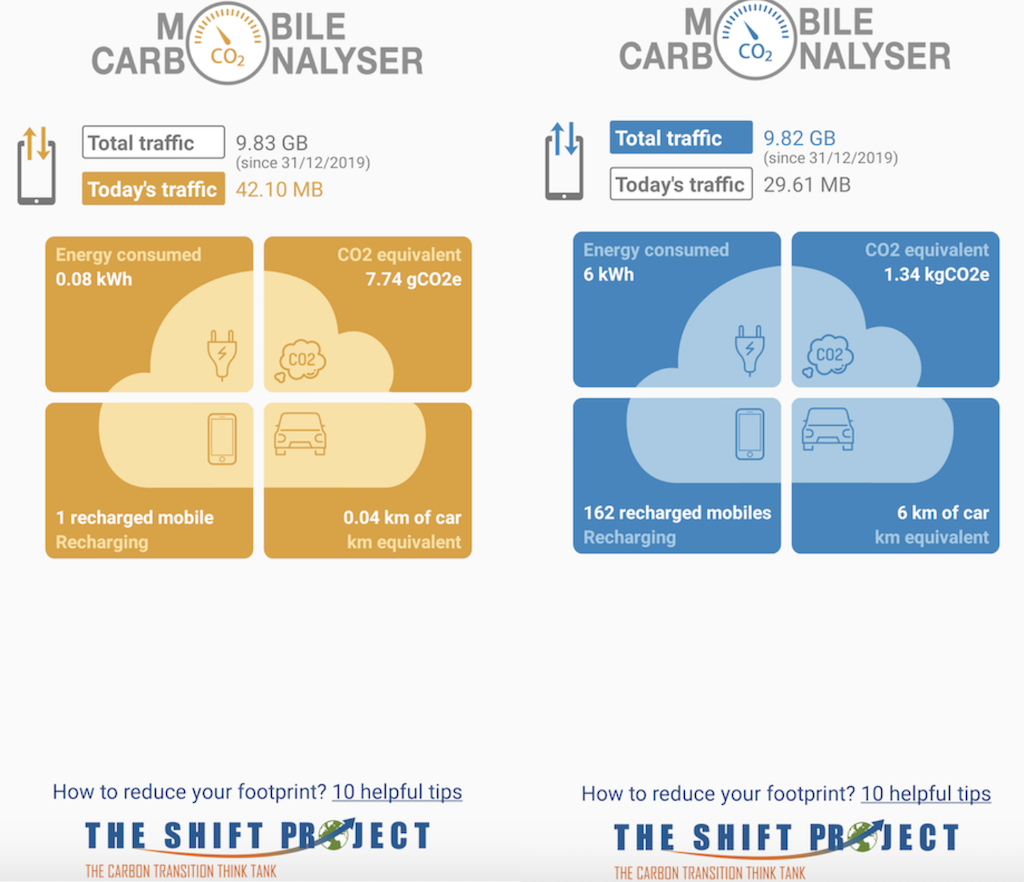
Currently, Carbonanalyser is available for download as an add-on on Firefox and on Chrome, as well as a phone app called “Mobile Carbonanalyser” on Google Play.
Carbonanalyser measures your online activity’s climate impact by first tracking the quantity of data travelling through your internet browser. It then looks at how much electricity this traffic requires via The Shift Project’s “1byte” model, a system that models the electricity consumed by data centres, network infrastructures such as Wifi, and the specific device used to browse the internet.

Using its modelling data, Carbonanalyser then calculates the greenhouse gas emissions that correspond to the electricity use. To provide a more accurate result, users can select where in the world they are browsing the internet from, so that country-specific data on electricity mix – the ratio of fossil fuels vs. renewable energy sources – can be included in the calculation.
The average electricity mix in the European Union, for instance, has a carbon intensity footprint of 0,276 kgCO2e/kW. Meanwhile in China, this rises to 0,681 kgCO2e/kWh. The global average carbon intensity factor is estimated to be around 0,519 kgCO2e/kWh.
All the information is clearly shown to users, from quantity of data to electricity consumption, alongside visual comparisons of the greenhouse gases emitted by internet browsing, versus other activities such as charging a smartphone and driving a car.
The organisation hopes that the extension will help more people understand the impact that digital devices can still have on the environment, a lesser known source of global carbon emissions that is set to rise exponentially as the world operates increasingly online.

“Visualising it will get you to understand that impacts of digital technologies on climate change and natural resources are not virtual, although they are hidden behind our screens,” said The Shift Project in its description of the tool.
According to Climate Care, just one Google search can produce anywhere between 0.2 to 7 grams of carbon dioxide emissions – 7 grams equates to driving a car 52 feet. Emails containing lots of information or sent to multiple contacts can generate up to 50 grams of carbon dioxide – that’s enough energy use to power 6.4 average smartphones.
To allay privacy concerns, the extension also pledges to only analyse browsing data directly on the user device, and does not require the data to be sent or processed anywhere else.
A similar online carbon calculator has been developed by Wholegrain Digital, a British company that helps clients, ranging from businesses and large-scale organisations to charities, to identify how to create and achieve a sustainable website. The calculator helps users find out the carbon generated by each website, and also identifies features that can be changed to reduce the site’s carbon footprint, from loading speed to design and page weight budget.
Individuals can also take action on minimising our digital footprint. While opting out from digital devices may be practically impossible in today’s modern societies, we can make small changes such as adjusting our power settings or blocking data tracking to save energy.
Lead image courtesy of Freepik.


